Datalogging just got easier!
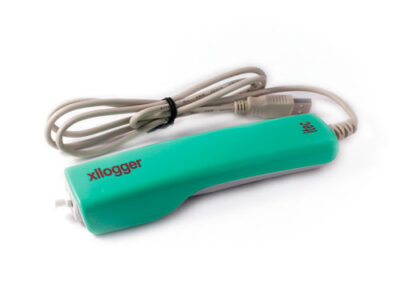
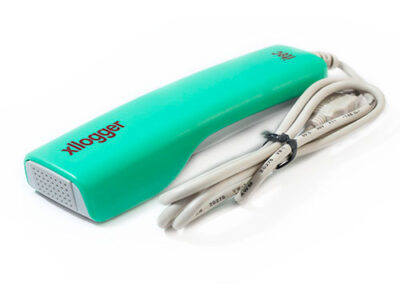
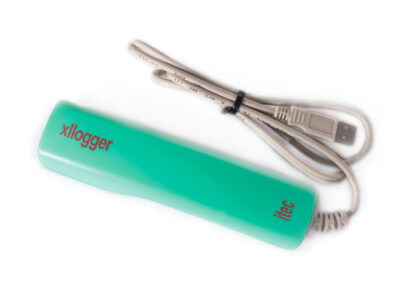
Sensors plug straight into USB ports on any Windows computer.

Easy Setup
Sensors plug straight into USB ports on any Windows computer. No expensive interface. Fewer messy leads!
Microsoft Excel
No dedicated software program required, just Microsoft Excel. Data is logged directly into Excel and graphed automatically.
Cost Effective
A wide range of cost effective sensors. Simply plug them in and start logging (no calibration needed).
What is Xllogger?
Xllogger is an innovative datalogging system that uses Microsoft Excel to capture and analyse data from USB sensors.
How does it work?
Xllogger is really simple to use in just four steps.
- Plug in the USB sensor(s) and open the Xllogger software.
- Use the easy-to-use toolbar buttons to set
up your data capture parameters for hte sensors. - Allow Excel to tabulate and graph the data automatically.
- Work in the familiar, yet powerful environment to Excel to carry out further analysis if you wish.
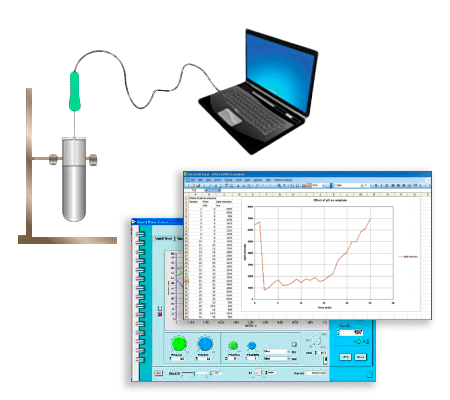
Software.
xllogger is built around Excel* because this is the standard graphing and calculation package used by schools and colleges throughout the world.
Because data is captured directly into Excel* there is no need to export and move data from one package to another – unlike other datalogging systems.
xllogger has incorporated into Excel* all the requirements of standard datalogging software, but with the additional advantage of access to all the calculating power of Excel* for better data analysis.
Installation is a simple procedure on any standalone PC or laptop, or on any network. Once installed, xllogger is always available from within Excel*. Sensors are auto-recognised when plugged in and automatically change range and sensitivity when needed without any input from the user.
 xllogger uses a series of toolbars to enable you to navigate the software easily. Main and analysis toolbar.
Autolog: use this for continuous logging where sample time and duration are not important.
Logging settings: choose duration of activity, sample time, plus graph titles etc.
Snapshot: use for taking individual readings when time is not a variable, e.g. in Ohms Law or environmental fieldwork. A unique feature of Snapshot is the ability to label each measurement individually.
Timing settings: for use with light gates for recording timing in dynamics experiments. Pre-set options makes this a simple task for pupils.
Repeat: Carry out a repeat of the same experiment and average the results.
Work in progress: allows experiments to be saved as files and then sent to other users – who can then open the file, click Repeat and add further data series.
Display options: there are a range of display options such as full screen and large digital display.
Graph formatting toolbar: provides all you need to manipulate your graphs.
Graph plots toolbar: gives you complete control over which plots to display.

Free Software Download
Click the button below to download the Xllogger software and user guide for free.
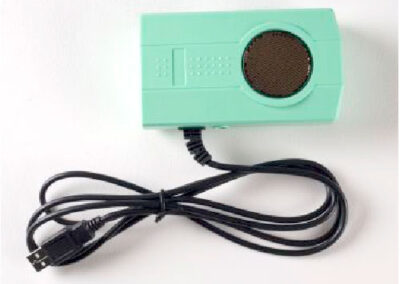
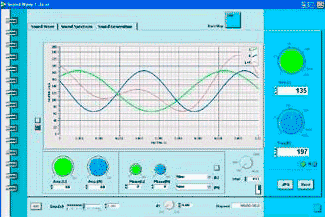
Innovative software that captures sound and allows you to generate sound waves as an on-screen oscilloscope. Valuable for teaching about the nature of sound waves, including the differences between various musical instruments.
• use the Microphone to display sound waveforms,
• analyse the frequency spectrum of a sound
• generate a range of sounds and display the wave form
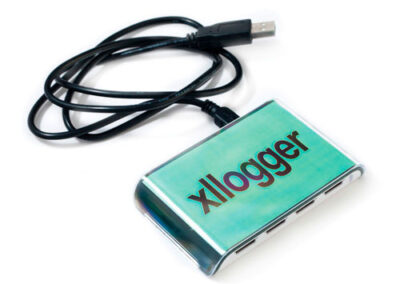
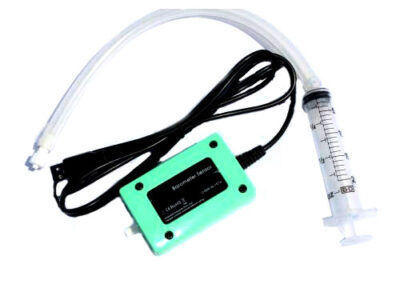
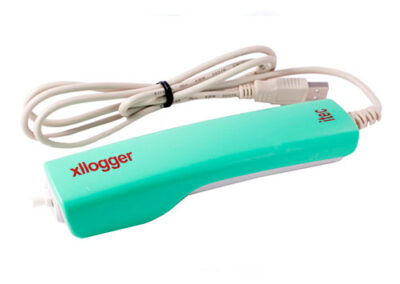
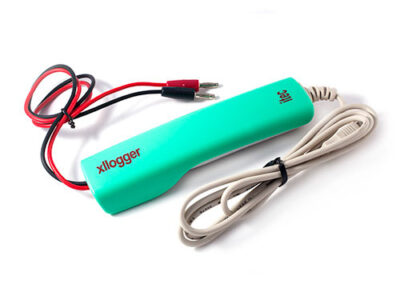
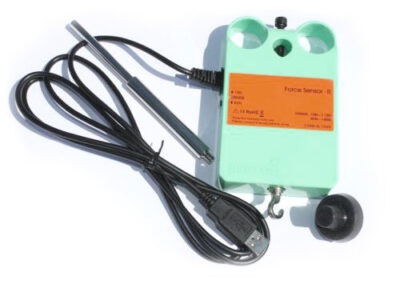
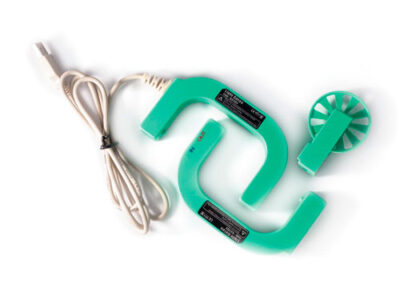
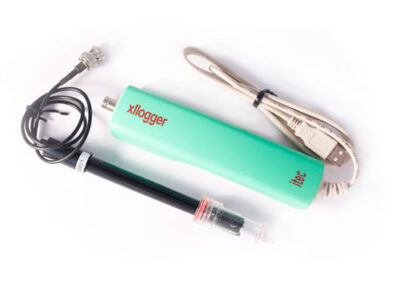
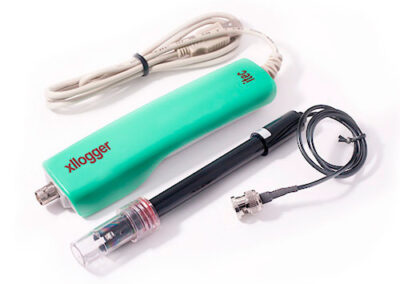
xllogger sensor range.
Worlddidac Award Winner
Part of the excessive range of sensors and accessories from xlogger.
To find out more about xlogger and available products please contact us or visit www.ipcirwin.com.
Find out more!
For more information on the xllogger range of sensors and products please visit www.ipcirwin.com or make an enquiry using the contact form below.
Contact us.
PHONE
ADDRESS
Holker School,
Cark-in-Cartmel,
Grange-Over-Sands,
Cumbria LA11 7PQ
United Kingdom
LA11 7PQ
